|
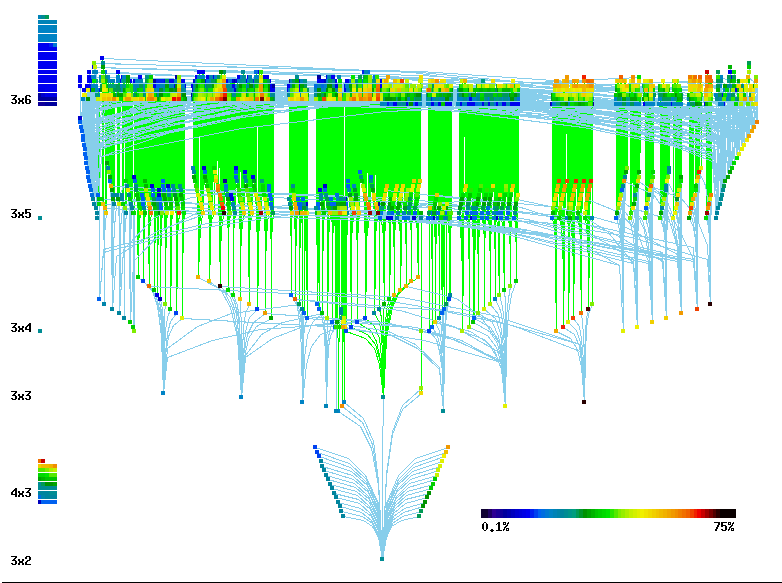
Graph of all Bistables 
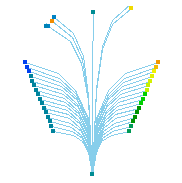
Each colored square represents a bistable reaction scheme. Click on any square to go to the selected reaction. The color represents the propensity for this topology to be bistable, that is, the fraction of cases that were found to be bistable when assigned random parameters. The pale blue lines connect smaller models (below) to larger bistable models which can be formed by adding a single reaction to the smaller model. Edges from "Root topologies" are in sky blue and from other topologies are in green.
|
